4-8-8 Change rectangular chart axis settings
This section describes axis settings for rectangular charts (bar chart, line chart, and area chart).
The following settings can be changed in Axis settings, Category axis settings, and Value axis settings in the Chart settings dialog:
The series assigned to value axes
Whether to use value axis #2
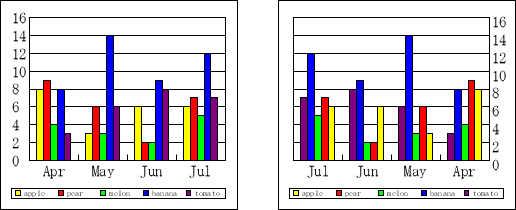
Axis reversal
Scale and auxiliary scale
Scale and auxiliary scale gridlines
Axis labels
Attribute-formula
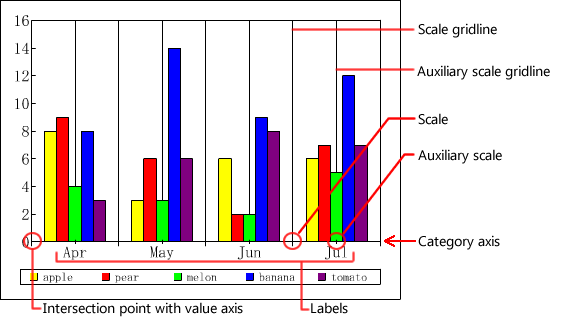
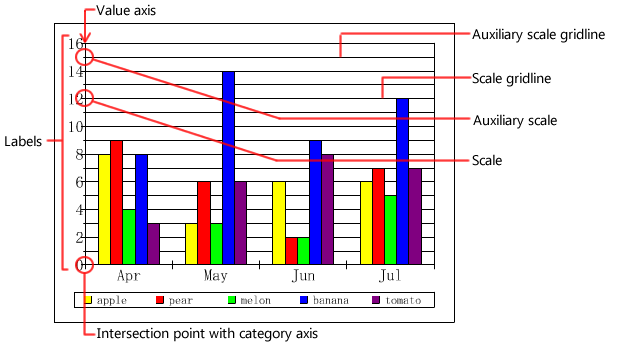
For details on the display examples of series in rectangular charts and the positions of the category and value axes, see "4-8-1 Chart components".
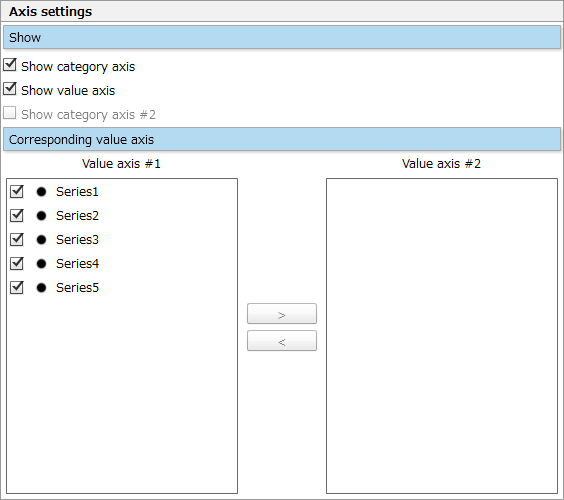
Axis settings
The setting items on the Axis settings tab are as follows:
Item | Description |
|---|---|
Show | Specify whether to show or hide the category axis, value axes and category axis #2. |
Corresponding value axis | Specify the data series to be assigned to value axis #1 and value axis #2. The data series set to value axis #2 is displayed on top of the data series for value axis #1. |
Restriction
Even if you select the check box of Show category axis #2, category axis #2 does not appear if you do not specify a data series for Value axis #2 in Corresponding value axis. Category axis #2 may be displayed completely overlapping category axis #1.
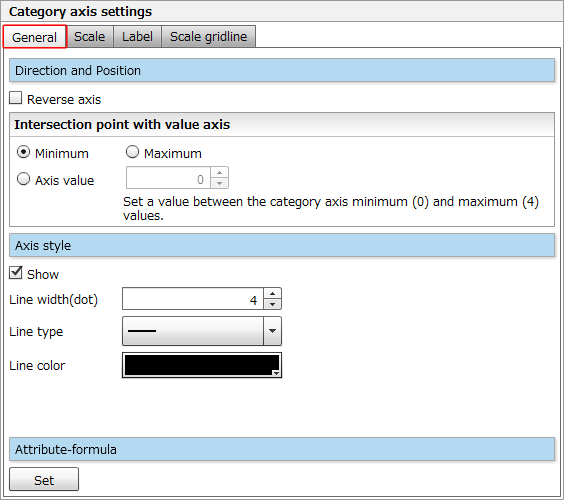
Category axis settings
Specify the category axis styles, the intersection point with the value axis, the scale and auxiliary scale on the category axis, and other properties.
Category axis direction, style and attribute-formula on the "General" Tab
The setting items on the General tab are as follows:
Item | Description |
|---|---|
Direction and Position |
|
Axis style, Attribute-formula | Specify the style and attribute-formula of the category axis. The setting procedures are the same as those for chart area borders and attribute-formulas. For details, see "Border style" or "Attribute-formula" in "4-8-5 Change chart area settings". |
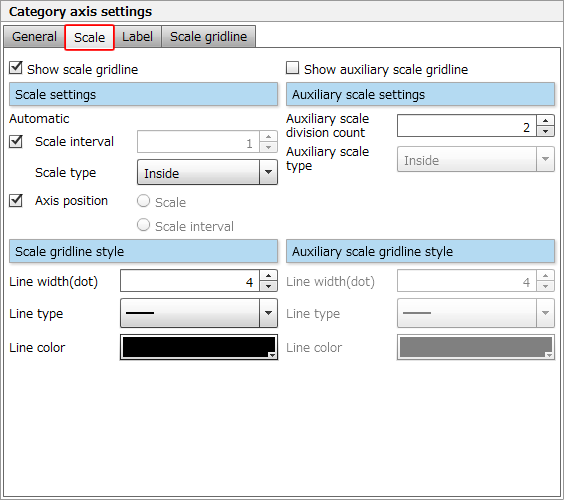
Category axis scale and auxiliary scale - Scale tab
The setting items on the Scale tab are as follows:
Item | Description |
|---|---|
Show scale gridline | Select the check box to display the scale. |
Scale settings |
|
Scale gridline style | Specify the scale style. The setting procedure is the same as that for chart area borders. For details, see "Border style" in "4-8-5 Change chart area settings". |
Show auxiliary scale gridline | Select the check box to display the auxiliary scale. You cannot configure this setting if you have cleared the Show scale gridline check box. |
Auxiliary scale settings | Specify the division count and type of the auxiliary scale. Specify the division count within the range of 2 to 10. |
Auxiliary scale gridline style | Specify the auxiliary scale style. The setting procedure is the same as Scale gridline style. |
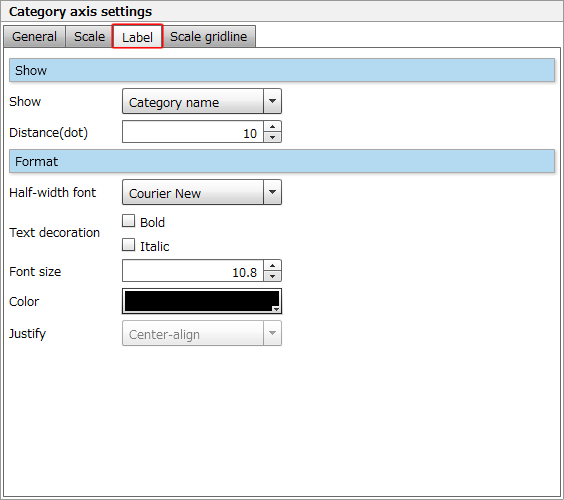
Category axis labels on the "Label" tab
The setting items on the Label tab are as follows:
Item | Description |
|---|---|
Show |
|
Format | Specify the font, text decoration, font size, text color and text alignment of the labels. The setting procedure is the same as that for legend text. For details, see "Legend string- "Format" tab" in "4-8-6 Change legend settings". |
Category axis scale and auxiliary scale gridlines on the "Scale gridline" tab
The setting items on the Gridline tab are as follows:

Item | Description |
|---|---|
Show scale gridline, Show auxiliary scale gridline | To show scale and auxiliary scale gridlines, select the respective check boxes. You cannot set auxiliary scale gridlines if you have cleared the check box for Show scale gridline. |
Scale gridline style, Auxiliary scale gridline style | Specify the scale and auxiliary scale gridline styles. The setting procedure is the same as that for chart area borders. For details, see "Border style" in "4-8-5 Change chart area settings". |
Value axis settings for rectangular charts
Specify the value axis styles, the intersection point with the category axis, the scale and auxiliary scale on the value axis, and other properties.
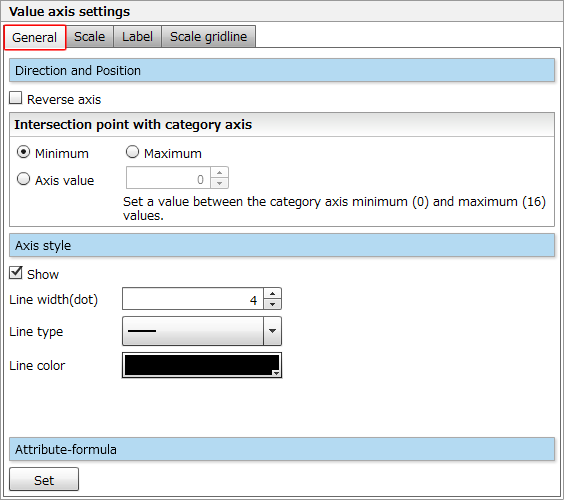
Value axis direction, style and attribute-formula on the "General" tab
The setting items on the General tab are as follows:
Item | Description |
|---|---|
Direction and Position | Specify the direction and position of the value axis. The setting procedure is the same as Direction and Position of the category axis (Replace "category axis" with "value axis", and "value axis" with "category axis"). |
Axis style, Attribute-formula | Specify the style and an attribute-formula of the value axis. The setting procedures are the same as Axis style and Attribute-formula of the category axis. |
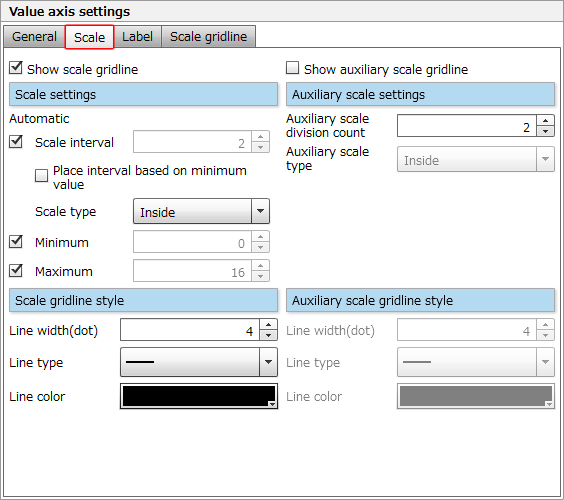
Value axis scale and auxiliary scale on the "Scale" tab
The setting items on the Scale tab are as follows:
Item | Description |
|---|---|
Show scale gridline | Select the check box to display the scale. |
Scale settings |
|
Scale gridline style | Specify the scale style. The setting procedure is the same as Scale gridline style of the category axis. |
Show auxiliary scale gridline | Select the check box to display the auxiliary scale. You cannot configure this setting if you have cleared the Show scale gridline check box. |
Auxiliary scale settings, Auxiliary scale gridline style | Specify the division count, type and style of the auxiliary scale. The setting procedures are the same as Auxiliary scale settings and Auxiliary scale gridline style of the category axis. |
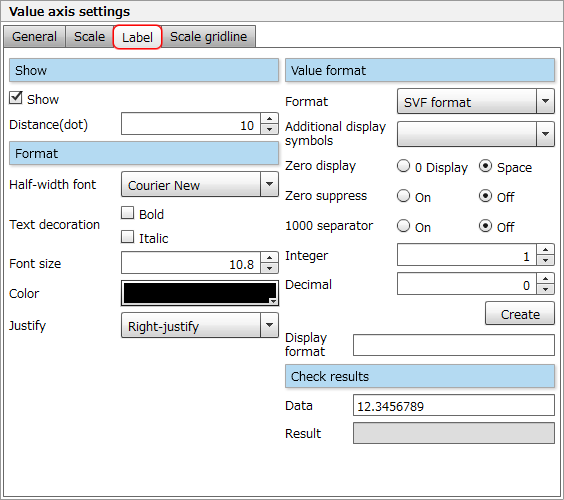
Value axis labels on the "Label" tab
The setting items on the Label tab are as follows:
Item | Description | ||||||||||
|---|---|---|---|---|---|---|---|---|---|---|---|
Show | Specify whether to show or hide labels and, if they are displayed, the distance between the labels and the axis. | ||||||||||
Format | Specify the font, text decoration, font size, text color and text alignment of the labels. The setting procedure is the same as Format of the category axis. | ||||||||||
Value format | Select a label format.
| ||||||||||
Check results | When "SVF format" is selected in Data, if you input a value in Data, a formula which has been automatically created based on the Value format settings is applied to the value of Data and displayed in Result. |


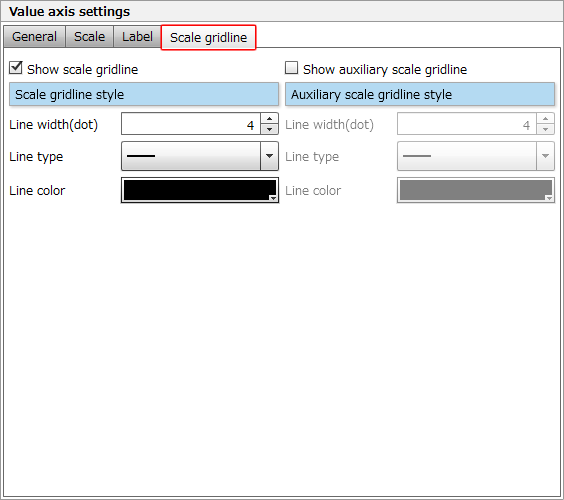
Value axis scale and auxiliary scale gridlines on the "Scale gridline" tab
The setting items on the Gridline tab are as follows:
Item | Description |
|---|---|
Show scale gridline, Show auxiliary scale gridline | To show scale and auxiliary scale gridlines, select the respective check boxes. You cannot set auxiliary scale gridlines if you have cleared the check box for Show scale gridline. |
Scale gridline style, Auxiliary scale gridline style | Specify the styles of the scale and auxiliary scale gridlines. The setting procedures are the same as Scale gridline style and Auxiliary scale gridline style of the category axis. |