4-8-1 Chart components
This section describes the general components of charts.
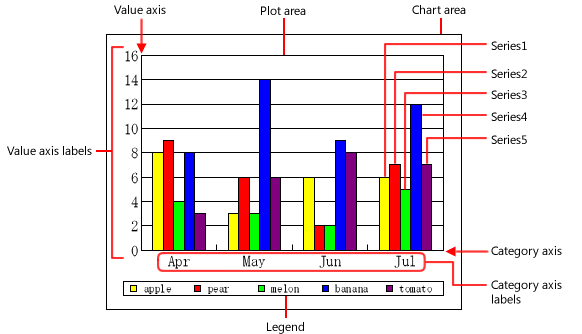
Rectangle charts (bar chart, line chart, and area chart)
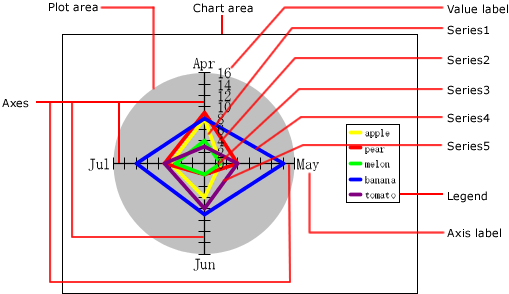
Circular charts (radar chart)
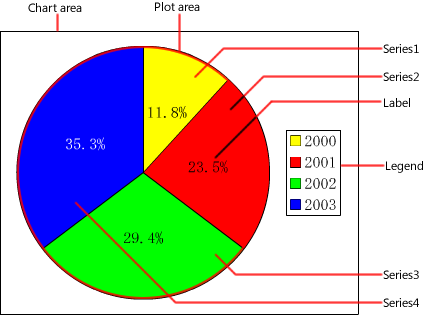
Circular charts (pie chart and doughnut chart)
Relationship to table data
Charts are created according to table data.
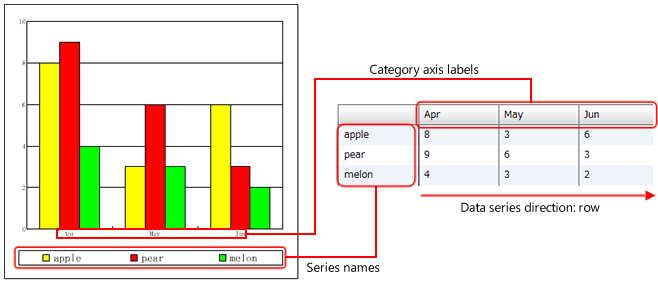
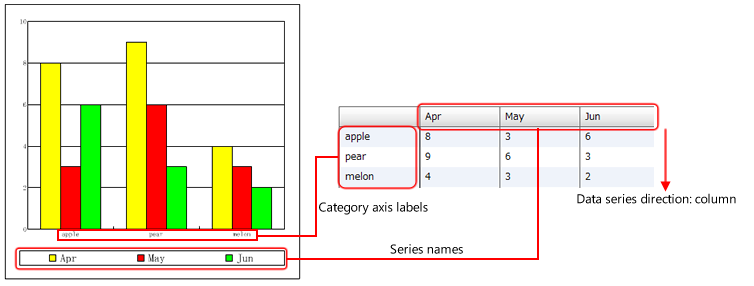
In a rectangular chart (bar chart, line chart, or area chart), the category axis labels and data series names are determined according to whether data series are in rows or columns in the source data table.
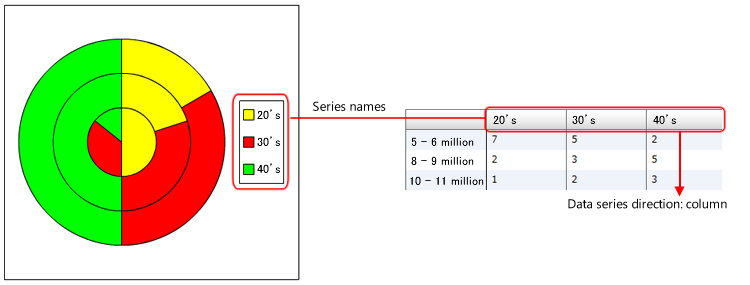
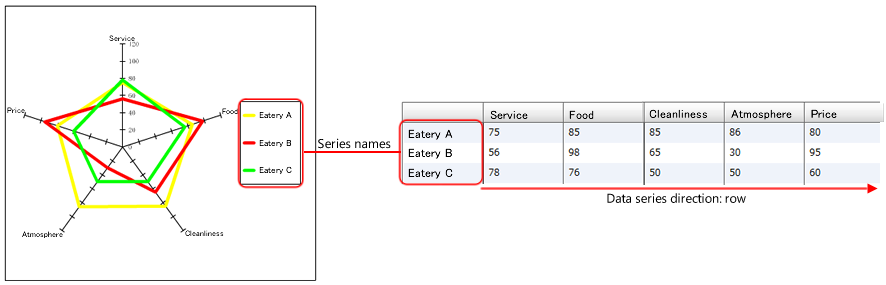
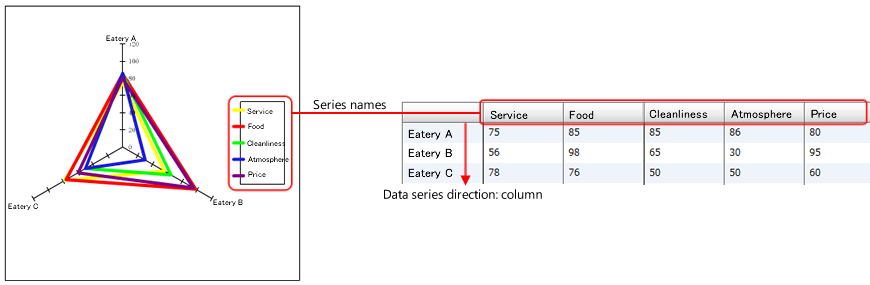
In a circular chart (radar chart, pie chart, or doughnut chart), data displayed as data series vary depending on whether data series are in rows or columns in the source data table.
The relationship between charts and the directions of categories and data series in the source data is as follows:
For rectangle charts (bar chart, line chart, and area chart)
Data series direction: row
Data series direction: column
For circular charts (radar chart)
Data series direction: row
Data series direction: column
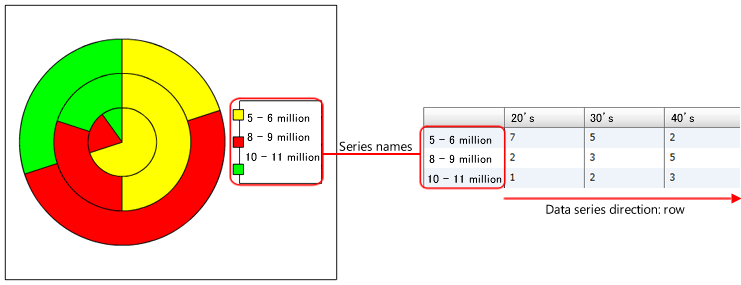
For circular charts (pie chart and doughnut chart)
Data series direction: row
Data series direction: column