4-8-7 Change plot area settings
You can change the following settings in Plot area settings in the Chart settings dialog:
Whether to show or hide a border for the plot area
Border and background styles for the plot area
Setting items of Plot area settings are the same for both rectangular and circular charts.
For details on the range of the plot area in each chart, see "4-8-1 Chart components".
Set a plot area
The setting items of Plot area settings are as follows:
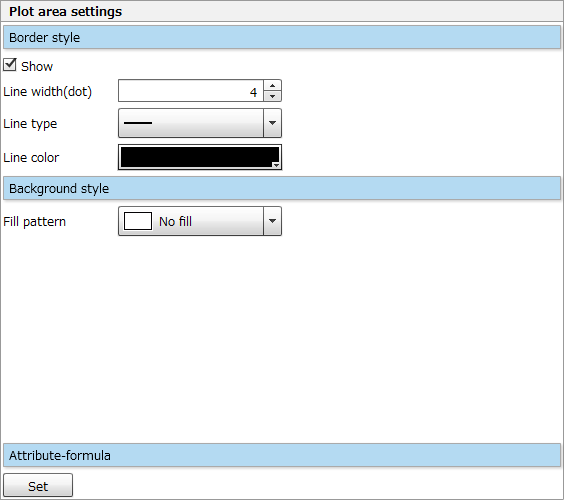
Item | Description |
|---|---|
Border style, Background style, and Attribute-formula | Specify the border and background styles and an attribute-formula for the plot area. The setting procedure is the same as for chart areas. For details, see "Border style", "Background style", and "Attribute expressions" in "4-8-5 Change chart area settings". |