4-8-9 Change circular chart axis settings
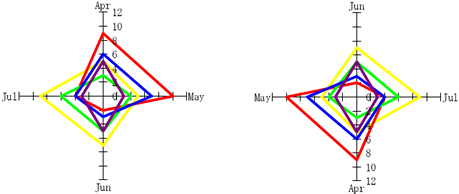
This section describes settings for circular chart (radar chart) axes.
You can change the following settings in Axis settings in the Chart settings dialog:
Axis origin and rotation direction
Axis scales and auxiliary scales
Axis scale and auxiliary scale gridlines
Axis labels and value labels
Attribute-formula
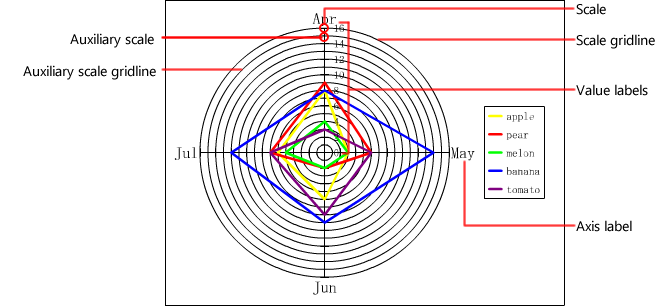
For details on the positions of axes and labels in a radar chart, see "4-8-1 Chart components".
Reference
Radar charts are the only circular charts that have axes.
Axis settings
Set axis scales and scale gridlines, labels and other properties.
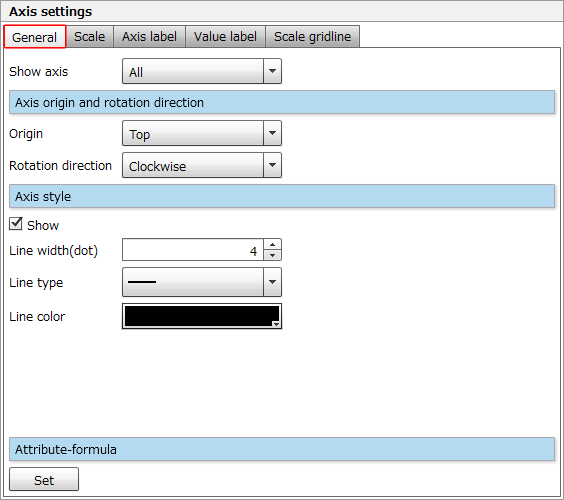
Set axis direction, style and attribute-formula on the "General" tab
The setting items on the General tab are as follows:
Item | Description |
|---|---|
Show axis | Specify an axis to be displayed.
|
Axis origin and rotation direction | Specify the axis origin and rotation direction.
|
Axis style, Attribute-formula | Specify axis style and attribute-formula. The setting procedures are the same as those for chart area borders and attribute-formulas. For details, see "Border style" or "Attribute-formula" in "4-8-5 Change chart area settings". |
Set the axis scale and auxiliary scale on the "Scale" tab
Specify the axis scale and auxiliary scale on the Scale tab. The setting procedure is the same as for the Scale tab of rectangular chart value axes.
For details, see "Set the value axis scale and auxiliary scale on the "Scale" tab" in "4-8-8 Change rectangular chart axis settings".
Set axis labels on the "Axis label" tab
Set axis labels on the Axis label tab. The setting procedure is the same as the Label of rectangular chart category axes.
For details, see "Set category axis labels on the "Label" tab" in "4-8-8 Change rectangular chart axis settings".
Set scale labels on the "Value label" tab
Set scale labels on the Value label tab. The setting procedure is the same as the Label of rectangular chart value axes.
For details, see "Set value axis labels on the "Label" tab" in "4-8-8 Change rectangular chart axis settings".
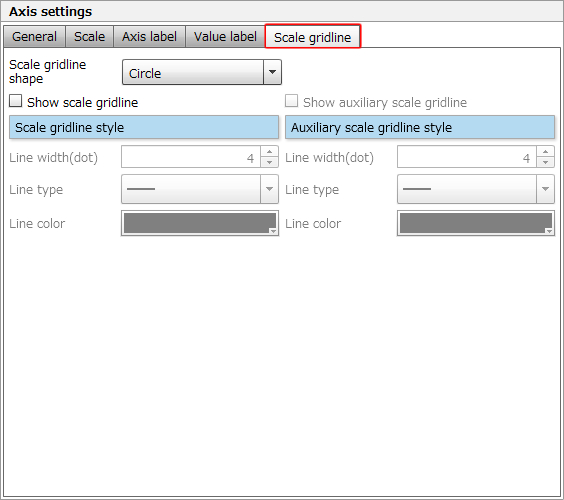
Set scale gridlines and auxiliary scale gridlines on the "Scale gridline" tab
The setting items on the Gridline tab are as follows:
Item | Description |
|---|---|
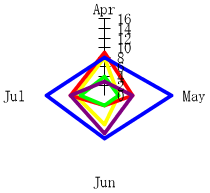
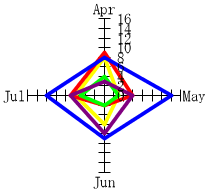
Scale gridline shape | Select the shape of the scale gridlines extending from the scale and auxiliary scale gridlines extending from auxiliary scale from "Circle" or "Polygon". |
Show scale gridline, Show auxiliary scale gridline | To show scale and auxiliary scale gridlines, select the respective check boxes. You cannot set auxiliary scale gridlines if you have cleared the check box for Show scale gridline. |
Scale gridline style, Auxiliary scale gridline style | Specify the styles of the scale and auxiliary scale gridlines. The setting procedure is the same as Axis style. |