Data series properties (circular chart)
This section describes the property settings for the "data series" of circular charts.
Set corresponding axis, marker type, and style for data series ("General" tab)
Items displayed in the General tab are different for pie charts, doughnut charts, and radar charts.
For pie chart/doughnut charts, set the fill colors and borders for the series in the General tab.
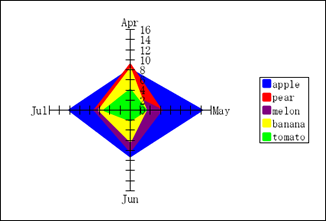
For radar charts, Fill style can be set when Radar Attributes - Internal fill is selected in the Data marker tab of the chart properties.
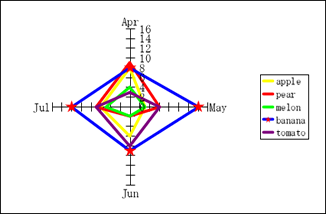
If you do not select this check box, you cannot set the fill style. However, you can set auxiliary markers.
Radar chart with fill color
Radar chart with auxiliary markers
Items displayed in the General tab are different for pie charts, doughnut charts, and radar charts. See the applicable items.
Item | Description |
|---|---|
Line style | To display the line, select Show and specify the line width, line type, and line color. RestrictionIf you clear this check box without setting the fill color, the data series does not appear on the chart. You can still select the data series. If you select the data series, it is displayed with dotted lines. |
Fill style | Specify the fill color for the data series. Settings are the same as those for chart areas. For details, see "Set the background color and border of the chart area ("General" tab)". However, you can use only Gradation2 for gradation, and cannot specify the diagonal direction. |
Auxiliary marker style | In radar charts, auxiliary marker style settings appear when fill color settings are disabled. Specify the auxiliary marker shape, size, and color. When auxiliary markers are set (left) and when auxiliary markers are not set (right) 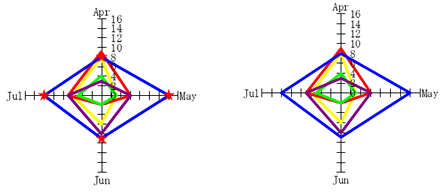 |
Set the item label ("Label" tab)
In the Label tab, you can specify the contents to be displayed as item labels as well as the formats such as label font and size.
Settings are the same as those for rectangle charts. For details, see "Set the item label ("Label" tab)".
Reference
When Use leader line is selected in the Data marker tab of the Chart Properties dialog, if you set the Distance(dot) field to intentionally display a label outside the circle, there will always be a leader line for that label.
Set individual categories in only one data series ("Category color" tab)
For graphs with only one data series, you can set color for each category in this tab.
Settings are the same as those for rectangle charts. For details, see "Set individual categories in only one data series ("Category color" tab)".
Item | Description |
|---|---|
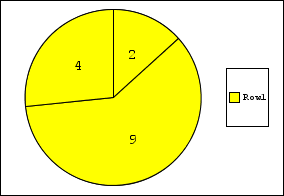
Set fill color for each category | Select the check box to change the fill color for each item. If you select the check box, color settings for each category appear, so set the color. 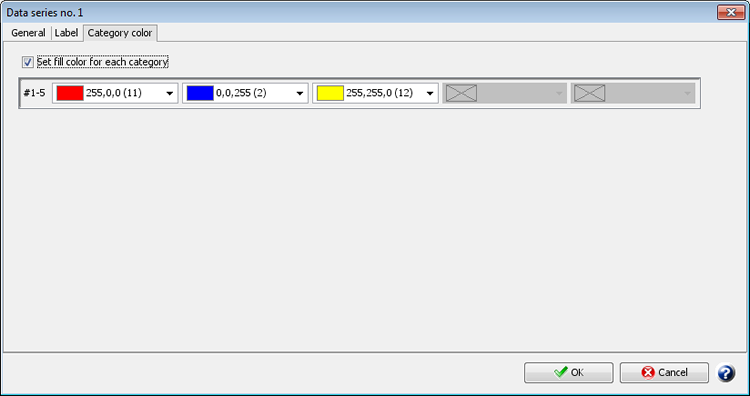 Chart where color is set for each category 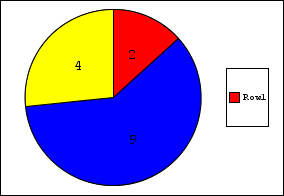 ReferenceFor radar charts, the color set in the Category color tab is reflected as the fill color of auxiliary markers. However, it is reflected only when " 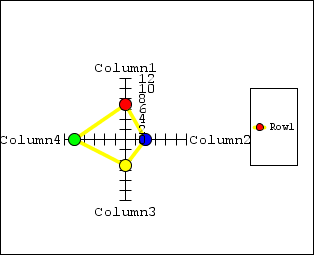 |


