Set format of data series
You can change the following settings for each data series:
Settings of the corresponding value axis
Marker type
Fill color and border of the data series
Settings of data series label such as display contents, font, color, and other format settings
Colors for the items
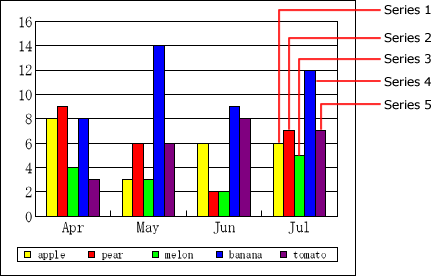
For rectangle charts (bar chart, line chart, and area chart)
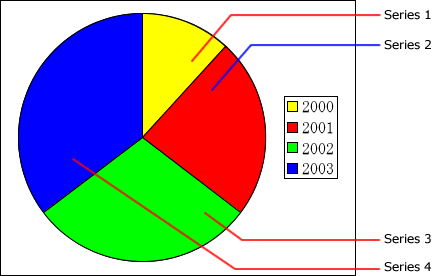
For circular charts (pie chart and doughnut chart)
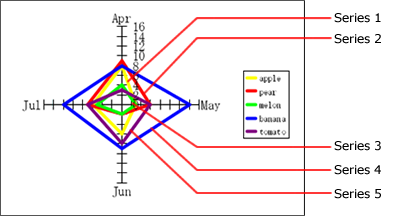
For circular charts (radar chart)
Procedure
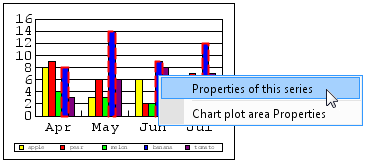
Select the chart series and select Properties of this series from the right-click menu. Alternatively, double-click the data series.
You can also select Data series Properties - <Data_series_name> from the right-click menu of the plot area.
For rectangle charts (bar chart, line chart, and area chart)
The data series properties dialog appears. Properties are grouped into tabs according to their contents.
Settings are different for rectangle charts and circular charts.
Set the items as needed and click the OK button.
The properties dialog closes and the settings are reflected.