Axis properties (radar chart)
This section describes the "Axis properties" settings for radar charts.
Set the direction and style of the axis ("General" tab)
In the General tab, set the axis origin, axis rotation direction, and line style.
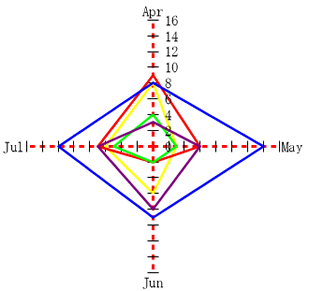
The following figure shows dotted red lines indicating the axis in a circular chart:
Item | Description |
|---|---|
Axis origin and rotation direction |
|
Axis style | Specify the line width (dot), type, and color of the axis. |
Attribute-formula | Specify an attribute-formula. |
Set the gridline ("Scale" tab)
In the Scale tab, you can configure the display settings of the gridline on the axis. Settings specific to circular charts are as follows.
Other settings are the same as those for the category axis of rectangle charts. For details, see "Set the scale ("Scale" tab)".
Item | Description |
|---|---|
Scale settings |
|

Set the value label ("Value label" tab)
In the Value label tab, you can specify the show/hide mode of the value label, the format settings such as font type and size, and the value label format. Settings are the same as those for the category axis of rectangle charts. For details, see "Set the axis label ("Label" tab)".
Set the axis label ("Axis label" tab)
In the Axis label tab, you can specify the contents to be displayed as axis labels as well as the formats such as label font and size. Settings are the same as those for the category axis of rectangle charts. For details, see "Set the axis label ("Label" tab)".