Set format of chart area
You can change the following settings for the basic format of charts:
Settings of frame and background of the chart area
Show/hide setting of the data series
Settings of value axis (first/second) to be used
Settings of data markers (general attributes settings)
Reference
Values specified in the dialog for chart settings are reflected in real time in the chart on the form window.
You can control the display by specifying attribute-formulas from properties of each item of the chart. For details on how to specify an attribute-formula for a chart, see "Set attribute-formula on chart item".
Procedure
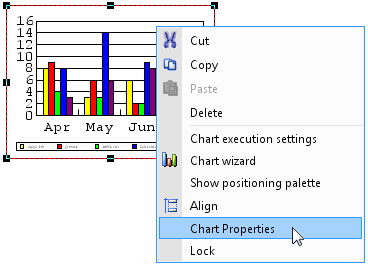
Select the chart area and then select Chart Properties from the right-click menu. Alternatively, double-click the chart area.
For rectangle charts (bar chart, line chart, and area chart)
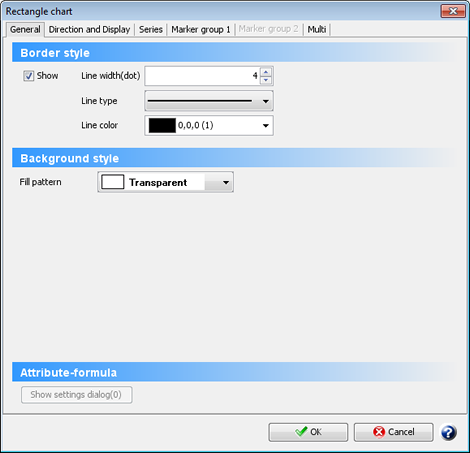
The property dialog for "rectangle charts" or "circular charts" appears. Properties are grouped into tabs according to their contents.
The settings vary between "rectangle charts" and "circular charts".
Chart properties dialog (for "Rectangle chart")
Set the properties items and click the OK button.
The properties dialog closes and the settings are reflected.