Create chart items
Because charts can represent data visually, you can use them to create forms that compare data and analyze trends. Chart is an item that can only be configured in graphic mode.
There are two methods to create a chart.
Use fixed data files
Import a specific CSV file and create a chart by using the values in the file. To output data of a different CSV file, use the SET_CSV function for an attribute-formula.
For details on the SET_CSV function, see "SET_CSV" in "Chart functions".
Dynamically generate a chart
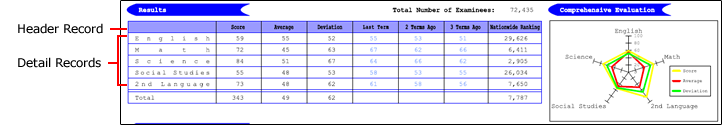
Dynamically create a chart by referring to the fields or static text in an XML form file. You can also create a chart in a record.
For example, in the following form, the fields of the detail records that contain scores, average values and deviation values are referenced as the data series of the radar chart, while the static texts in the header record are referenced as the data series names.