Set data to be output to a chart (when creating dynamic chart)
Use the Chart execution settings dialog to configure data output settings.
When a chart has just been created, it is drawn based on the sample data. To generate a chart dynamically by referencing the field data and static text in an XML form file, associate the chart with the referenced data in Reference data settings. You can also create a chart in a record.
This section describes the procedure for setting the data to be output to the chart when creating a dynamic chart.
Prerequisite
Chart items have been placed.
Procedure
Display the "Chart execution settings" dialog
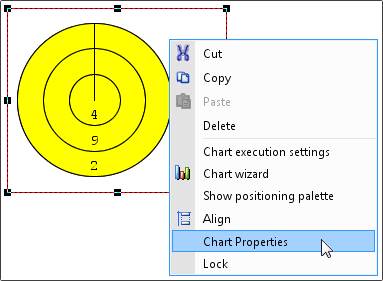
Select the chart area and then select Chart execution settings from the right-click menu.
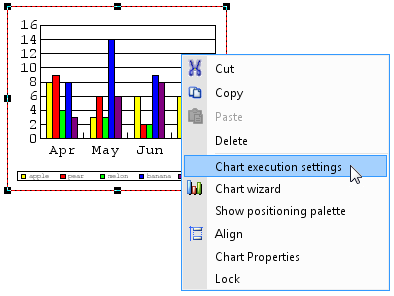
The Chart execution settings dialog appears.
Associate reference data with chart
Click the Sample data tab in the Chart execution settings dialog.
The Sample data tab appears.
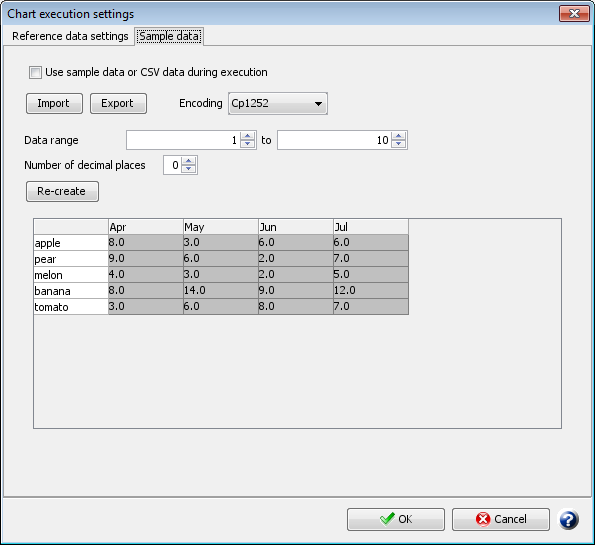
Confirm that the Use sample data or CSV data during execution is deselected.
If selected, all the settings of the Reference data settings tab are disabled, and a chart is created based on the values of the sample data.
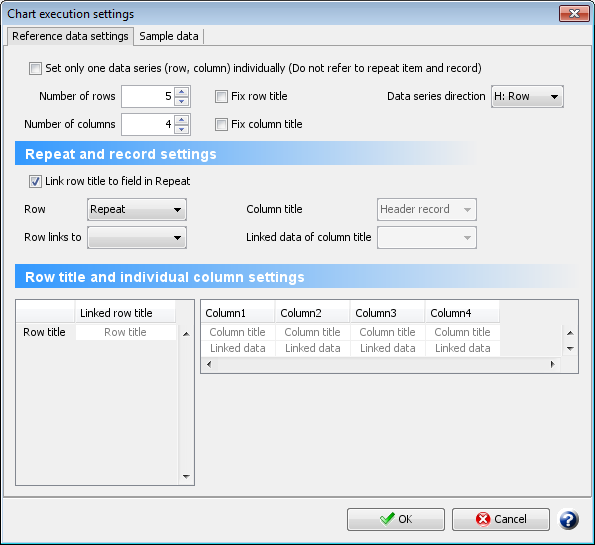
Click the Reference data settings tab in the Chart execution settings dialog.
The Reference data settings tab is displayed.
Set the number of rows, number of columns, data series direction, and referenced data and so on.
Click the Sample data tab.
The Sample data tab appears. In the data display area of the dialog, the sample data is automatically generated in accordance with the number of rows and columns set in the Reference data settings tab.
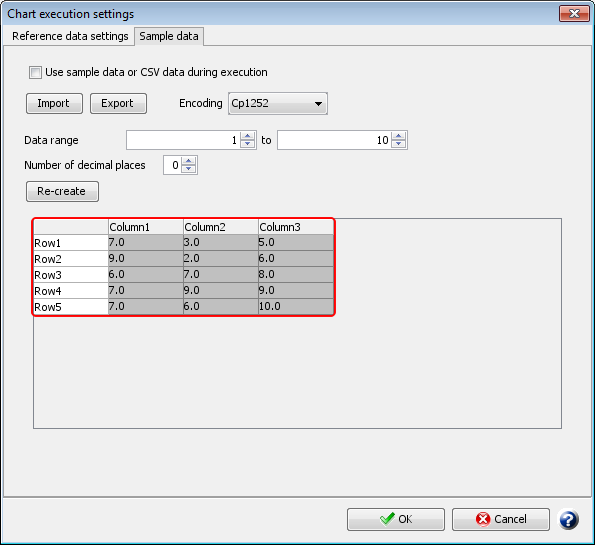
You can change the sample data. To change the sample data, import any CSV file or re-create the sample data by changing the Data range. For details on changing sample data, see "Check the chart display differences with outputting different data".
Restriction
If you import a CSV file having the number of rows and columns different from the specification in the Reference data settings tab after you specify a field to be referred and a fixed title in the Reference data settings tab, consistency with the settings of the Reference data settings tab is not guaranteed.
Click the OK button.
The settings are saved.
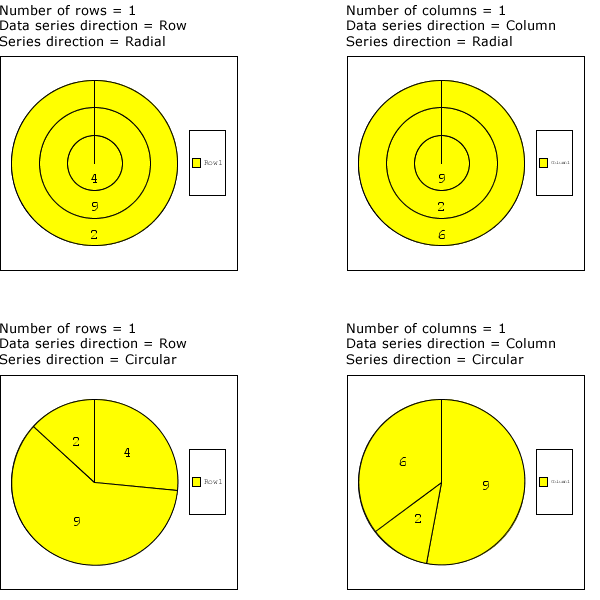
When a pie chart representing 100% of a single series is created
The following settings for pie charts and doughnut charts creates a pie chart where 100% allocated to each series.
When the number of rows is "1", the direction of the series is "Row", and the direction of the series is "Radial"
When the number of column is "1", the direction of the series is "Column", and the direction of the series is "Radial"
In these cases, you need to change the series direction to Circular. It is changed with the following procedure.
Procedure
Select the chart area and then select Chart Properties from the right-click menu.
The Chart Properties dialog is displayed.
Click the "Data marker" tab.
The "Data marker" tab is displayed.
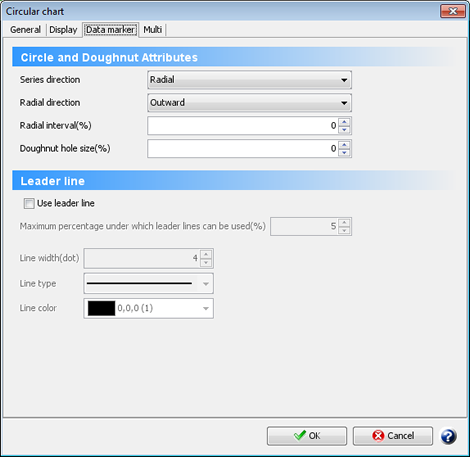
Change "Series direction" from "Radial" to "Circular".