Set data to be output to a chart (when using fixed data)
Use the Chart execution settings dialog to configure data output settings.
Immediately after creating the chart, the chart is drawn based on the sample data. When using fixed data, you can create a source data file in the CSV format, and import it as a data file for creating charts. At the time of execution, the imported data file can be output as a chart as it is. You can also use the SET_CSV function of an attribute-formula to change the data file specification. By using the SET_CSV function of an attribute-formula, it is possible to output values that are not output to a form to a graph.
This section describes the procedure for setting the data to be output to a chart using fixed data.
Prerequisite
Chart items have been placed.
Procedure
Display the "Chart execution settings" dialog
Select the chart area and then select Chart execution settings from the right-click menu.
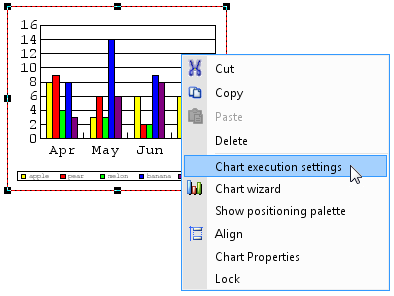
The Chart execution settings dialog appears.
Import CSV file
Prepare the source data file for charts in CSV format, and store it in any directory.
For details on CSV file formats, see "Format of fixed data to be output to a chart (CSV file)".
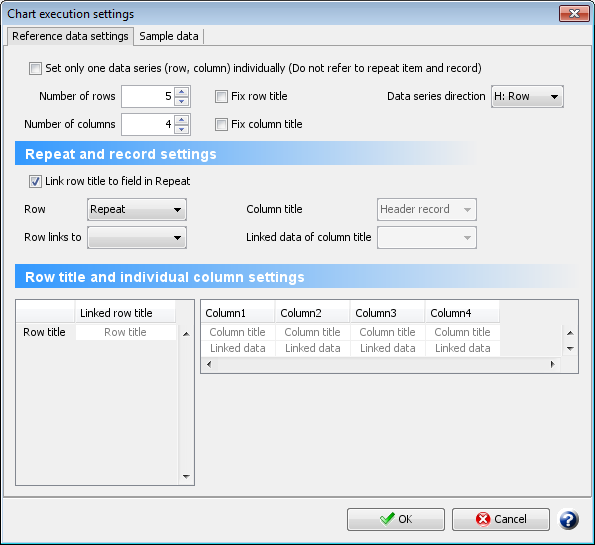
Click the Sample data tab in the Chart execution settings dialog.
The Sample data tab appears.
Select the Use sample data or CSV data during execution check box.
Reference
If you select the Use sample data or CSV data during execution check box, all the settings specified in the Reference data settings tab are disabled, and a chart is created based on the values in sample data.
If you want to dynamically change the sample data by using the SET_CSV function of an attribute-formula, select the Use sample data or CSV data during execution check box. For details on how to use the SET_CSV function of an attribute-formula, see "Use an attribute-formula to specify any CSV file to be imported during execution".
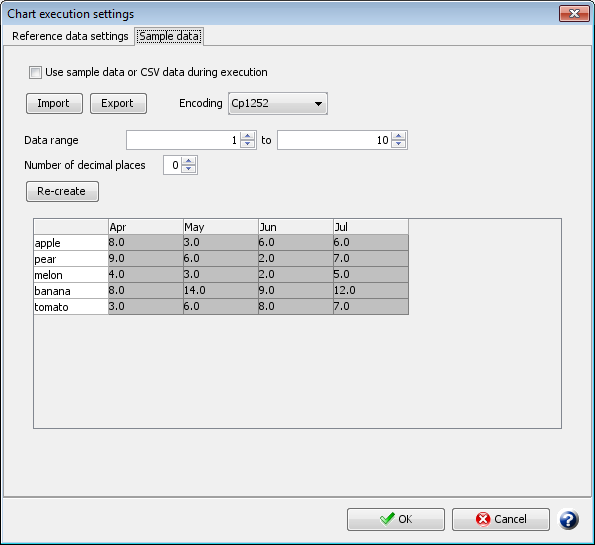
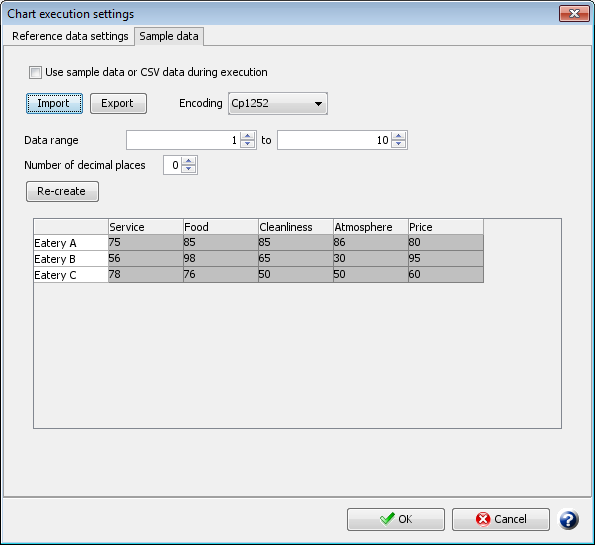
Click the Import button.
The Open dialog appears.
Import the CSV file that you prepared.
Imported data appears in the dialog table. A chart is generated with the imported data.
Reference
If you click the Export button, you can output the data in the data display area as a CSV file.
Click the OK button.
The settings are completed.
If you want to change the data file specification using the SET_CSV function of an attribute-formula at the time of execution, proceed to the next step.
Use an attribute-formula to specify any CSV file to be imported during execution
Specify a file using the following format in an attribute-formula of the chart area. For details, see "SET_CSV".
SET_CSV(CSVFilePath_string<,Encoding_string>)